Example: gui_display_plots
This example demonstrates mrpt::gui::CDisplayWindowPlots capabilities to show MATLAB/Octave-like plots directly from your C++ program.
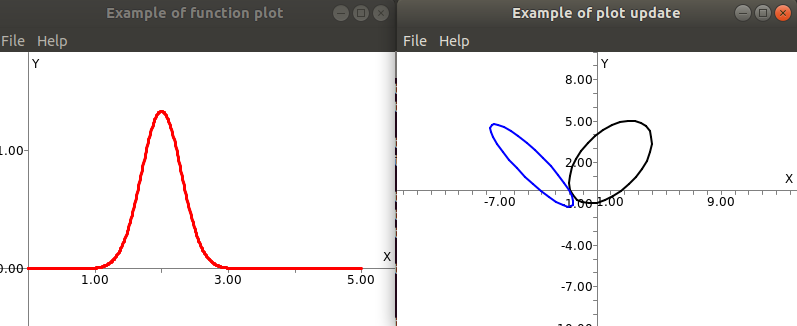
C++ example source code:
/*                    _
                     | |    Mobile Robot Programming Toolkit (MRPT)
 _ __ ___  _ __ _ __ | |_
| '_ ` _ \| '__| '_ \| __|          https://www.mrpt.org/
| | | | | | |  | |_) | |_
|_| |_| |_|_|  | .__/ \__|     https://github.com/MRPT/mrpt/
               | |
               |_|

 Copyright (c) 2005-2026, Individual contributors, see AUTHORS file
 See: https://www.mrpt.org/Authors - All rights reserved.
 SPDX-License-Identifier: BSD-3-Clause
*/

#include <mrpt/gui/CDisplayWindowPlots.h>
#include <mrpt/math/distributions.h>
#include <mrpt/system/os.h>

#include <chrono>
#include <iostream>
#include <thread>

using namespace mrpt;
using namespace mrpt::gui;
using namespace mrpt::math;
using namespace std;

void myOnMenu(int menuID, float x, float y, [[maybe_unused]] void* param)
{
  std::cout << "Menu: " << menuID << endl << " x=" << x << " y=" << y << "\n";
}

// ------------------------------------------------------
//              TestDisplayPlots
// ------------------------------------------------------
void TestDisplayPlots()
{
  CDisplayWindowPlots win("Example of function plot", 400, 300);

  win.enableMousePanZoom(true);
  win.addPopupMenuEntry("Mark this point...", 1);
  win.setMenuCallback(myOnMenu);

  // Generate data for a 2D plot:
  CVectorDouble X, Y;
  for (double x = 0; x < 5; x += 0.01f)
  {
    double y = math::normalPDF(x, 2, 0.3);
    X.push_back(x);
    Y.push_back(y);
  }

  win.plot(X, Y, "r-3");
  win.axis_equal(false);
  win.axis_fit();

  win.setPos(10, 10);
  // -----------
  CDisplayWindowPlots win2("Example of plot update", 400, 300);

  win2.enableMousePanZoom(true);

  // Add an unnamed & a named ellipse:
  float mean_x = 5;
  float mean_y = 0;
  CMatrixFloat ellipse_cov(2, 2);
  ellipse_cov(0, 0) = 1.0f;
  ellipse_cov(1, 1) = 1.0f;
  ellipse_cov(0, 1) = ellipse_cov(1, 0) = 0.5f;

  win2.plotEllipse(1.0f, 2.0f, ellipse_cov, 3, "k-2");
  win2.plotEllipse(mean_x, mean_y, ellipse_cov, 3, "b-2", "my_ellipse");

  win2.axis(-10, 10, -10, 10);
  win2.axis_equal(true);

  win2.setPos(450, 10);

  std::cout << "Press any key to exit..."
            << "\n";
  // win.waitForKey();

  float t = 0;
  ellipse_cov(0, 1) = ellipse_cov(1, 0) = -0.9f;
  while (!mrpt::system::os::kbhit() && win.isOpen() && win2.isOpen() && !win.keyHit() &&
         !win2.keyHit())
  {
    t += 0.05f;
    mean_x = cos(t) * 5;
    mean_y = sin(t) * 5;
    win2.plotEllipse(mean_x, mean_y, ellipse_cov, 3, "b-2", "my_ellipse");

    std::this_thread::sleep_for(50ms);
  }
}

// ------------------------------------------------------
//                      MAIN
// ------------------------------------------------------
int main()
{
  try
  {
    TestDisplayPlots();
    return 0;
  }
  catch (const std::exception& e)
  {
    std::cerr << "MRPT error: " << mrpt::exception_to_str(e) << "\n";
    return -1;
  }
}